实现一个日历图的一个展示图
TIP
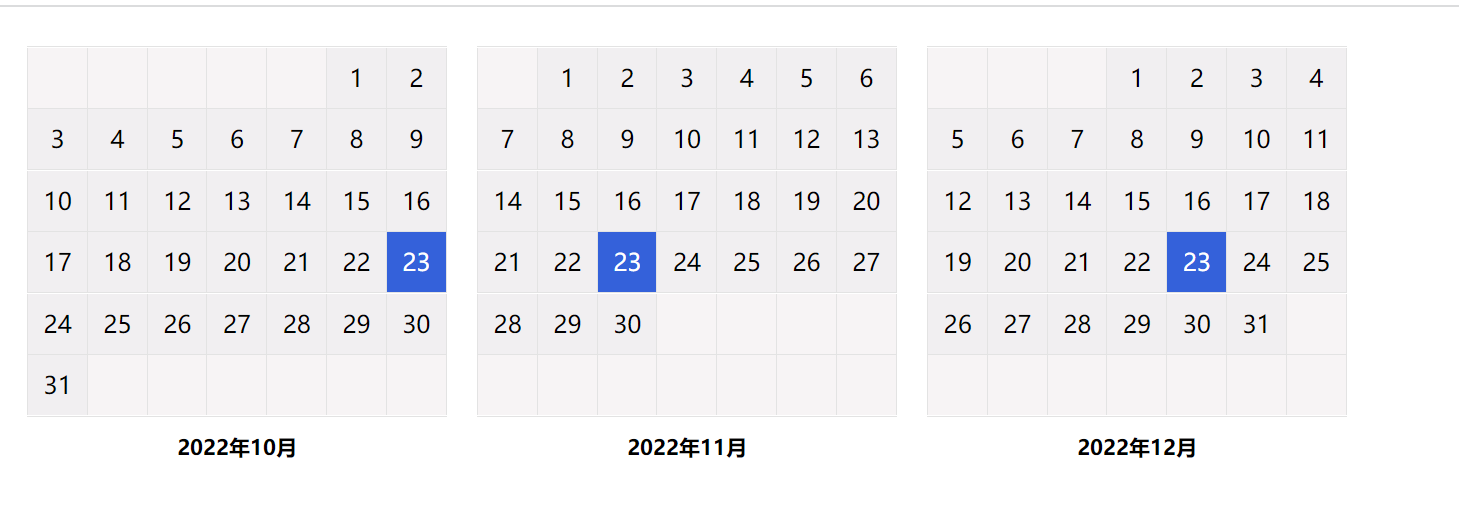
本文主要是实现一个日历月份的展示,支持高亮某些日子(当月的可以是多个)。展示效果如下图:
实现细节
- 区分每个月份几天(1-12),需要特俗处理2月份区分是不是闰月,其他月写个map映射下就好了。
- 每个月画6行7列进行展示
- 需要找每个月的开始绘制日期(比如10月1号是周5,那咱们就要在第一行的第五个开始绘制文本)。
vue 实现逻辑
TIP
源码实现如下 关键判断((row * 7) + (column + 1) >= startDay) && (row * 7) + (column + 1) < startDay + countDay 解读:限制最小开始日期 && 限制最大日期
vue
<!-- calendar-chart.vue -->
<template>
  <div class="calendar-container">
    <div class="calendar-container-header">
      <slot name="header" />
    </div>
    <div class="calendar-container-body">
      <div
        v-for="row in [0,1,2,3,4,5]"
        :key="`row-${row}`"
        class="calendar-row"
      >
        <div
          v-for="column in [0,1,2,3,4,5,6]"
          :key="`column-${column}`"
          class="calendar-column"
          :class="[
            {'is-action': actionDate.includes((row * 7) + (column + 1) - (startDay - 1))},
            {'is-have': ((row * 7) + (column + 1) >= startDay) && (row * 7) + (column + 1) < startDay + countDay}
          ]"
        >
          <span v-if="((row * 7) + (column + 1) >= startDay) && (row * 7) + (column + 1) < startDay + countDay">
            {{ (row * 7) + (column + 1) - (startDay - 1) }}
          </span>
        </div>
      </div>
    </div>
    <div class="calendar-container-footer">
      {{ footerValue }}
    </div>
  </div>
</template>

<script>
import {
  MONTH_MAP, getCurrentMonth, getFebruaryDay, getStartDay, getDate, getFullYear,
} from './utils';

export default {
  name: 'CalendarChart',

  props: {
    date: {
      type: Array,
      required: true,
      default: () => ['2021.10.23'],
    },
  },

  computed: {
    startDay() {
      return getStartDay(this.date[0]); // 用月份找到1号的开始值
    },

    countDay() { // 每个月的总共时间
      return MONTH_MAP[getCurrentMonth(this.date[0])] || getFebruaryDay(this.date[0]);
    },

    actionDate() { // 计算要高亮的天
      return this.date.map((item) => getDate(item));
    },

    footerValue() { // title
      return `${getFullYear(this.date[0])}年${getCurrentMonth(this.date[0])}月`;
    },
  },
};
</script>

<style lang="scss" scoped>
%flex-base {
  display: flex;
  flex-direction: row;
  flex-wrap: nowrap;
}
.calendar-container {
    display: inline-block;
    width: 280px;
    margin: 10px;
    .calendar-container-body {
      @extend %flex-base;
      flex-direction: column;
      .calendar-row {
        @extend %flex-base;
         border-top: 1px solid #E3E3E3;
        .calendar-column {
          text-align: center;
          width: 40px;
          height: 40px;
          line-height: 40px;
          border-left: 1px solid #E3E3E3;
          background-color: #F7F4F5;

          &.is-have {
            background-color: #F1EFF1;
          }

          &.is-action {
            background-color: #3461DA;
            color: #fff;
          }
        }

        >:last-child {
            border-right: 1px solid #E3E3E3;
        }

        &:last-child {
            border-bottom: 1px solid #E3E3E3;
        }
      }
    }

    .calendar-container-footer {
      width: 100%;
      height: 40px;
      line-height: 40px;
      text-align: center;
      font-weight: 700;
      font-size: 14px;
    }
}
</style>
js
// utils.js
export const getCurrentWeekDay = (date) => {
  const week = new Date(date).getDay();
  return week === 0 ? 7 : week;
};

export const getCurrentMonth = (date) => {
  const month = new Date(date).getMonth();
  return month + 1;
};

export const getFullYear = (date) => new Date(date).getFullYear();

export const isLeapYear = (date) => {
  const year = getFullYear(date);
  return (year % 4 === 0 && year % 100 !== 0) || year % 400 === 0;
};

export const getFebruaryDay = (date) => (isLeapYear(date) ? 29 : 28);

export const getDate = (date) => new Date(date).getDate();

export const getStartDay = (date) => {
  const formatDate = new Date(date).toLocaleString();
  let sum = 0;
  let findIndex = -1;
  for (let index = 0; index < formatDate.length; index++) {
    const element = formatDate[index];
    if (element === '/') {
      sum += 1;
    }
    if (sum === 2) {
      findIndex = index;
      break;
    }
  }
  return getCurrentWeekDay(formatDate.substring(0, findIndex));
};

export const MONTH_MAP = {
  1: 31,
  3: 31,
  5: 31,
  7: 31,
  8: 31,
  10: 31,
  12: 31,
  4: 30,
  6: 30,
  9: 30,
  11: 30,
};
使用方式
TIP
使用组件
vue
<template>
  <div>
    <calendar-chart :date=['2022.10.23']/>
    <calendar-chart :date=['2022.10.23']/>
    <calendar-chart :date=['2022.10.23']/>
  </div>
</template>

<script>
import CalendarChart from './calendar-chart.vue'

export default {
  components: { CalendarChart, }
}
</script>